
Stop Running Your Manufacturing Plant on Guesses
Your shift reports don't match what's actually happening on the line. XL shows you the downtime you're missing, the losses you didn't know existed, and exactly what to fix first.





See How XL Works
What's Actually Driving This Conversation
Few manufacturers set out looking for a monitoring system. Most arrive here because one or more of these is already costing them time, capacity, or credibility.

Spreadsheets and paper
Production totals still get written on a clipboard and typed up after the shift.

Numbers nobody trusts
Every version of the shift report tells a slightly different story, and nobody's sure which one is real.

Meetings that start with a disagreement
Operators, supervisors, and management each have a different account of what happened on shift.

Reports that arrive too late to matter
By the time a shift report reaches your desk, the problem it describes is already over.

No clear priority for the next project
Improvement work follows the most recent complaint rather than the largest loss.

No way to compare one line to another
Each line tracks downtime and OEE a little differently, so a plant-wide comparison rarely holds up.
If any of these sound familiar, here's what changes once XL is running on your line.
One Platform to See, Track, and Fix Production Losses in Real Time
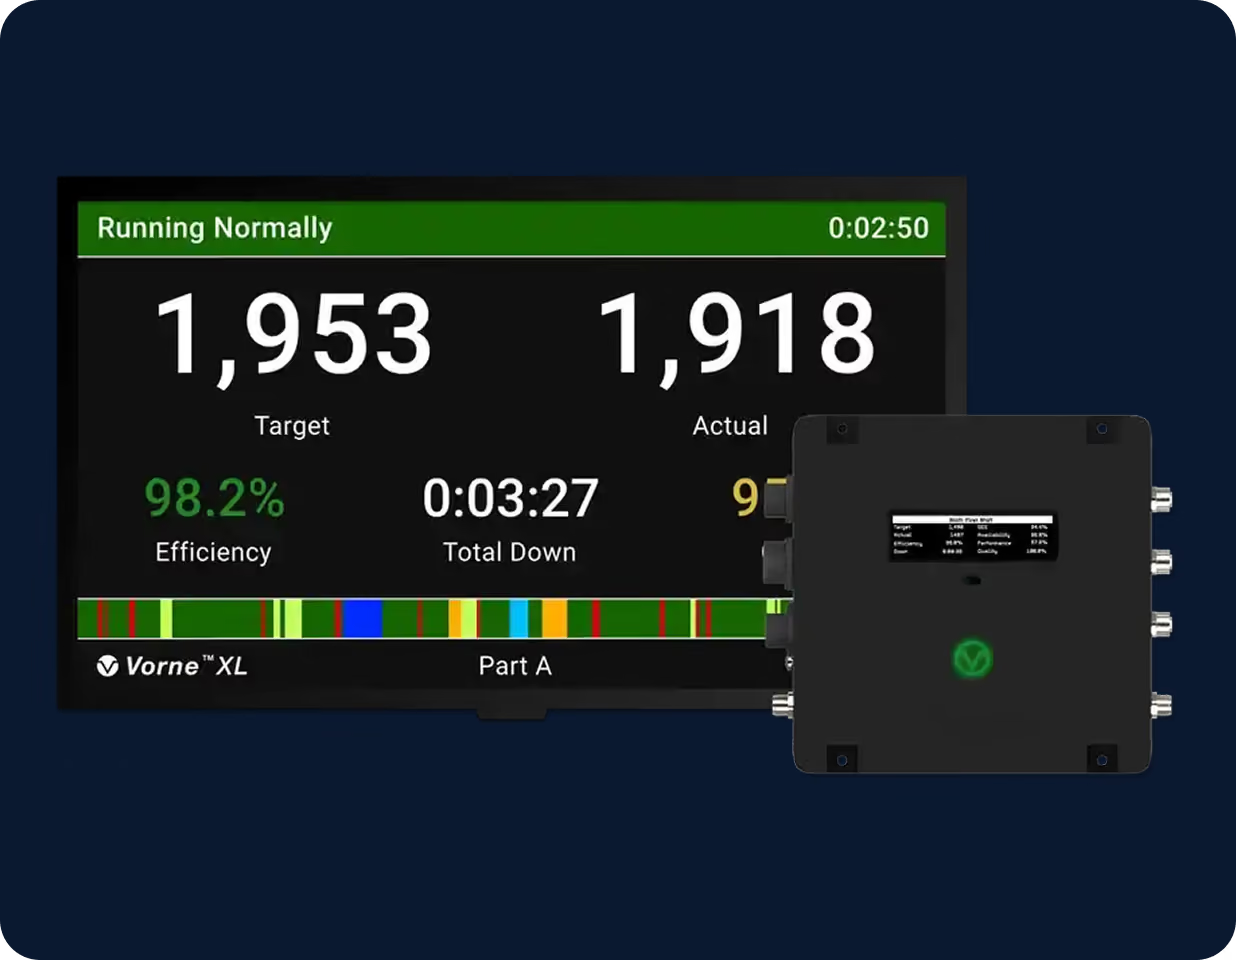
XL is a self-contained edge computing appliance, not a piece of software you install. It connects to your line, captures every cycle and downtime event straight from the sensors already on your machine, and turns those signals into the reports and scoreboards your team uses on the factory floor and in any browser. Supervisors spend their time solving problems instead of tracking counts by hand.
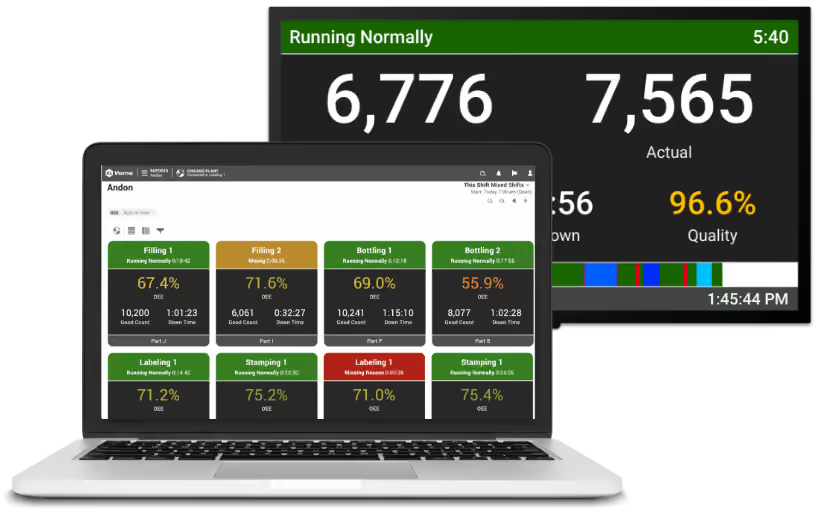
See What's Happening Right Now
Know which lines are running and which are down, updated every second across the plant. Operators, supervisors, and managers all see the same production status from anywhere on the network.
Know Which Losses are Actually Costing You
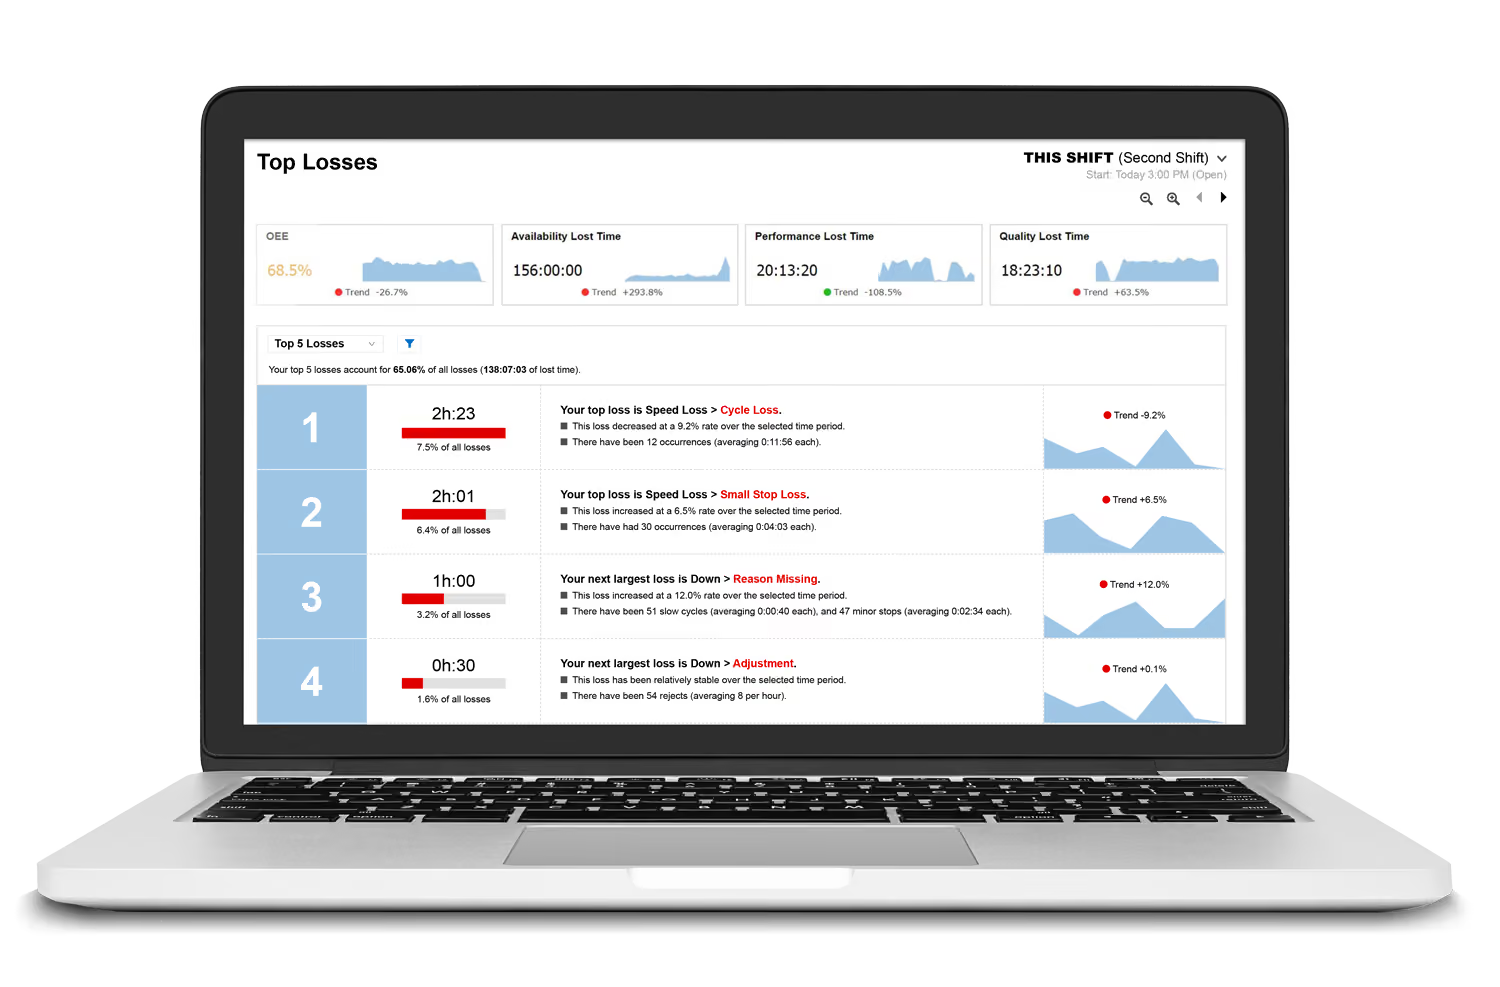
XL captures every downtime event automatically, down to the second, and ranks each loss, downtime, slow cycles, small stops, changeovers, and rejects, by how much time it costs. The next improvement project targets the biggest loss instead of the most recent complaint.
Give Operators a Target They Can Actually Hit
Interactive Pareto charts and loss breakdowns by category, machine, and time period. See the real cost of each stoppage type and identify the losses worth targeting first.
Compare Every Line the Same Way
Click any machine to see its current state, recent faults, stoppage durations, and performance against target. Built for operators who need to act fast and engineers who need to understand root cause.
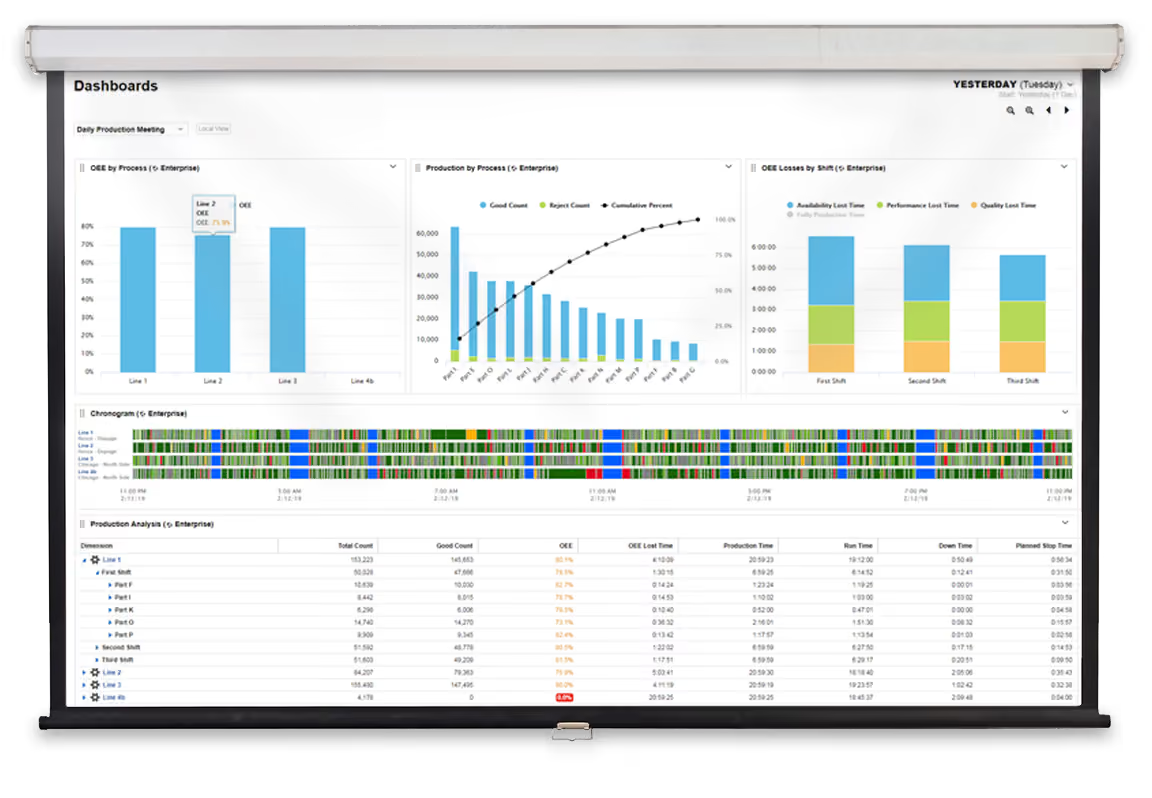
Base Production Meetings On Facts
Every XL runs the same OEE calculation and the same set of reports, whether it's watching an automotive stamping press, a pharmaceutical blister line, or a food case packer. A number from one line means the same thing on another, so comparing performance across sites finally holds up.
Under the Hood

Embedded Web Server
Every report and dashboard is browser-based. No client software to install, license, or keep updated on individual machines.
Event-Driven Alerts
XL Enterprise sends an email or text automatically when a line goes down, OEE drops below target, or a changeover is about to finish, so the next crew can have materials ready before the line restarts.
Multi-Dimensional Analytics
Filter and trend any KPI across 20+ dimensions, including shift, team, part, machine, and reason code.
Free Software Updates
New features ship automatically, the same way a smartphone updates. No upgrade fees, for the life of the unit.
What Makes XL Different

No Subscription Fees
A one-off investment with no recurring software licenses.

Installed in Hours
Running the same day, not next quarter, with no lengthy implementation project.

Secure by Design
Production data stays on-site, on your network, under your control.

No Complex IT
Connect sensors, connect to your network, start collecting data.

Risk-Free 60-Day Trial
See the value on your own line before making a long-term commitment.
Built to Fit Your Floor, Not the Other Way Around
XL is equipment-agnostic. If a process counts parts or cycles, XL can measure it, whether the machine is decades old or brand new.

Any Sensor, Any Age
Wire one or two sensors from an existing photo-eye, proximity switch, or encoder. No PLC coding changes required.

One Network Cable
Connect via a single ethernet cable. XL runs on your LAN, fully behind your existing firewall.

Scale Line by Line
Start with one line, add another next quarter, and roll out plant-wide when you're ready. Reports aggregate automatically.

Configure From a Browser
Set up parts, shifts, downtime reasons, and targets directly through the web interface.

From Unboxing to First Data
Connect Sensors
Wire into existing photo-eyes, proximity switches, or encoders on the machine.
Log Downtime
Operators scan a barcode or use the XL Sidekick app to tag reasons on the spot.
Join the Network
Assign an IP address, and the unit is live on your existing network.
Open a Browser
Reports, dashboards, and configuration load on any connected device.
From Snapshots to the Big Picture
A long-established confectionery manufacturer needed more capacity and a more predictable line, without a disruptive IT project.
Before XL, the team relied on periodic line studies and finished-goods data. The numbers were accurate, but only a snapshot of a single moment. XL gave them continuous visibility of downtime, performance, and OEE, so they could prioritize by fact instead of by whoever raised the last concern.
Every Role Gets What They Actually Need
XL collects the same production data once, then surfaces it differently depending on who's looking. Same facts, different views, and no argument about whose numbers are right.
Win the Shift With a Real-Time Target
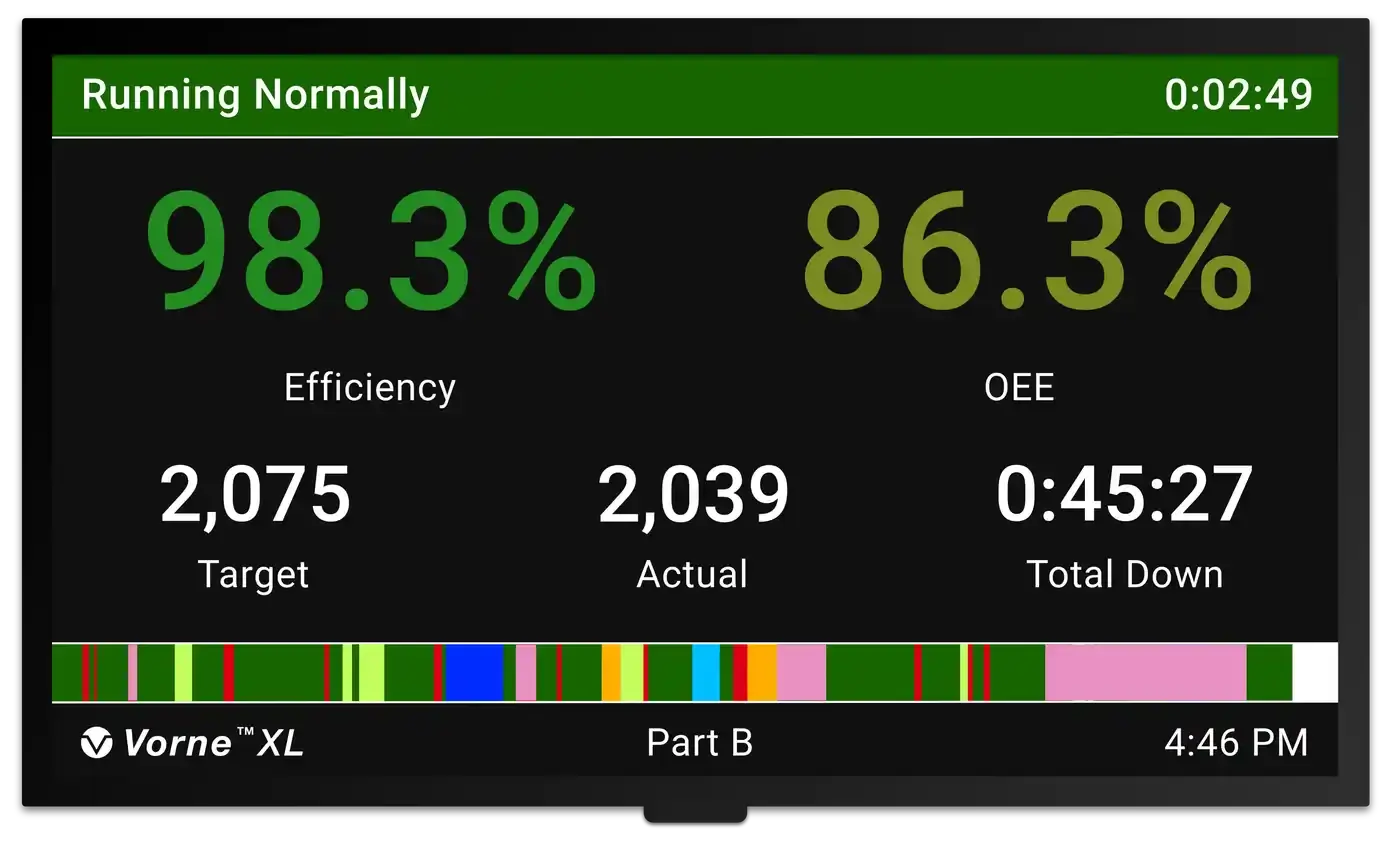
The scoreboard shows whether you're on pace or falling behind, so you know your status without waiting for an end-of-shift report.

Run Meetings in Minutes, Not Hours
Walk in with downtime data already pulled and ranked, so the meeting starts with deciding what to fix instead of reconciling separate logs.

See Where Time Is Bleeding Across the Plant
Walk in with downtime data already pulled and ranked, so the meeting starts with deciding what to fix instead of reconciling separate logs.

Prioritize by Impact, Not by Volume
Every improvement project starts from the same ranked list of losses, then tracks results against that same baseline over time.

Catch Problems Before They Break the Line
Track cycle time degradation and stop frequency over time, then schedule bearing replacements and belt adjustments during planned downtime.
Prove Your Changes Actually Worked
Compare performance before and after tooling changes, setup adjustments, or process tweaks, so an upgrade's payoff is measured, not assumed.

Technology Alone Doesn't Improve Performance
LineView combines XL technology with practical manufacturing and operational excellence expertise, helping customers turn production data into action.
- Manufacturing expertise
- Deployment support
- Operational improvement experience
- UK-based support
- Guidance beyond implementation
XL Doesn't Replace Your ERP, MES, or SCADA
It fills the gap they leave on the factory floor. Production data reaches the tools your team already uses through a REST API or off-the-shelf connectors.
